


US Accessibility Index


According to the US Census Bureau, it’s estimated that around 40 million people are living with a disability, emphasizing the need to make people’s lives as accessible as possible.
From being able to access a pharmacy online to the use of language towards those with a disability, efforts are being made to make America more accessible and equal. However, there is still more that can be done.
That’s why we wanted to know which states are the most accessible. We’ve looked at hospitals, healthcare expenditure, wheelchair-accessible activities, and more, to reveal the US’s most accessible states.
Rhode Island is the most accessible state in the US, with an accessibility score of 7.21 out of 10
To find out the accessibility capital of the US, we’ve looked into a variety of factors, including restaurants and health insurance costs, to give each state a score out of 10.
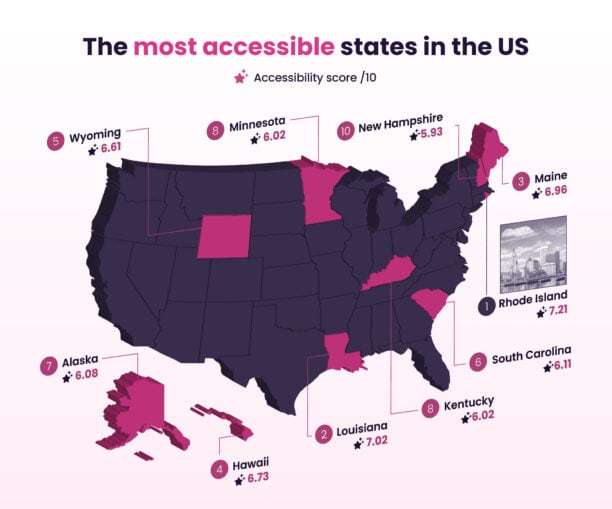
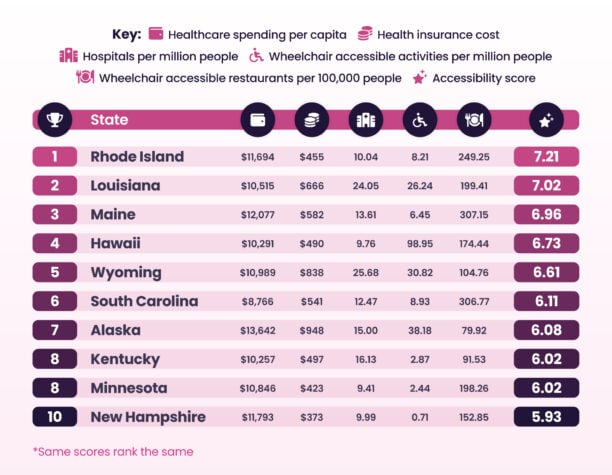
1. Rhode Island – 7.21 accessibility score
Taking the top spot as the accessibility capital of the US is Rhode Island, with an accessibility score of 7.21 out of 10. Despite having fewer hospitals, Rhode Island scores highly across the board, particularly for its wheelchair-accessible restaurants (250) and health insurance costs ($455). Rhode Island has 175 more accessible restaurants than our least accessible state, North Carolina, whilst also boasting cheaper health insurance by $183.
2. Louisiana – 7.02 accessibility score
In second place is Louisiana, with an accessibility score of 7.02 out of 10. Louisiana’s number of hospitals (24 per million), wheelchair-accessible activities (26 per million), and wheelchair-accessible restaurants (200 per 100,000) place this state so high in our rankings. Despite reasonably good healthcare spending per capita, health insurance in Louisiana is one of the most expensive in the US.
3. Maine – 6.96 accessibility score
Completing our top three is Maine, with an accessibility score of 6.96 out of 10. Maine scores highly on this list because of its number of hospitals (13.6), healthcare spending per capita ($12,000), and wheelchair-accessible restaurants (307). However, its health insurance cost is higher than in 28 other states, including Oregon, New Hampshire, and Washington.
New York’s healthcare spending is higher than any other state, at $14,007 per capita
Three of the largest spending categories for healthcare spending include hospital care, physician and clinical services, and prescription drugs. Together, these account for just over 70% of personal healthcare spending. Other categories include research, medical equipment, and retirement facilities. Below are the US states with the highest healthcare expenditures per capita.
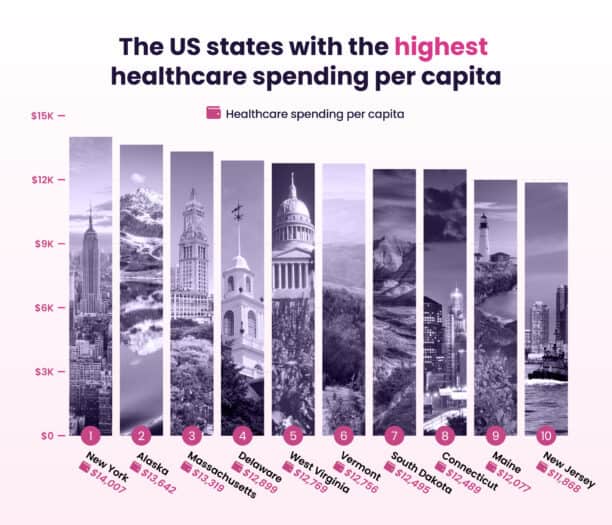
1. New York – $14,007 healthcare spending per capita
Taking the top spot is New York, with a healthcare spending per capita of $14,007. New York’s health care spending per capita was 37% higher than the national average and almost twice as much as Utah’s expenditure, which was $7,522 — the lowest in the US.
2. Alaska – $13,642 healthcare spending per capita
Alaska takes second place, with a healthcare spending per capita of $13,642. Alaska’s total spending on healthcare was $10 billion, which was the fourth lowest in the US. Alaska’s most costly spending category per capita was physician and clinical services, which totaled almost $5,000. This was higher than any other state per capita for this spending category.
3. Massachusetts – $13,319 healthcare spending per capita
Completing our top three is Massachusetts, with a healthcare spending per capita of $13,319. Massachusetts’s total spending on healthcare was $91.8 billion, the 12th highest in the US. Massachusetts’s most costly spending category was hospital care, which totaled $5,062, the eighth-highest in the US.
Health insurance in Alaska is more expensive than in any other state, at $948 per month
The average monthly cost of health insurance was $584 for a 40-year-old on a Silver plan, an increase of 4% from 2023. But which states have increased that average the most?
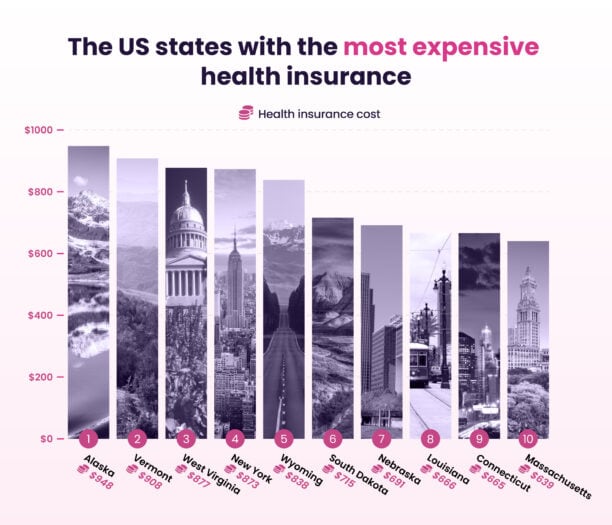
1. Alaska – $948 cost of health insurance per month
In 2023, the cost of health insurance was $822, the third highest in the US. However, after a 15% increase, the second-highest increase of any state, Alaska takes the top spot. In 2024, health insurance costs almost $950 a month on average.
2. Vermont – $908 cost of health insurance per month
In second place is Vermont, with the average price of health insurance costing $908 a month. The average cost in Vermont rose by almost $100, from $810 to $908. This was an increase of 12%, one of the highest increases from any US state.
3. West Virginia – $877 cost of health insurance per month
Our top three are completed by West Virginia, with health insurance costing $877 per month on average. West Virginia’s increase from 2023 to 2024 was one of the more stable percentage changes in the US, rising by just 1% from $871.
Wyoming boasts the most hospitals in the US, with 25.68 per million people
Whether it’s an emergency, or a regular check-up, having nearby access to a hospital can be extremely helpful. That’s why we’ve revealed the US states with the most hospitals per million people.
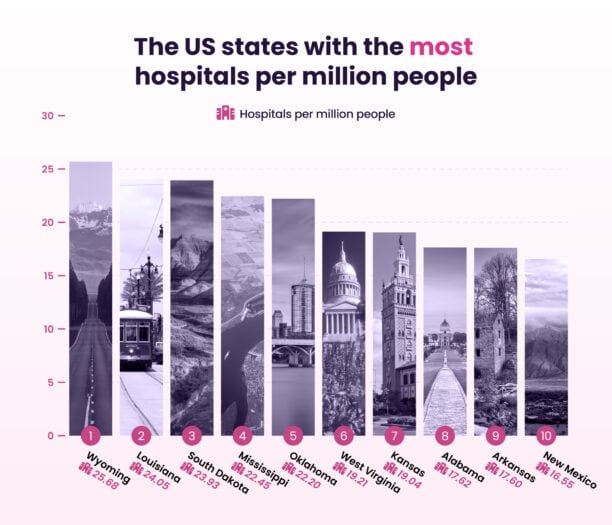
1. Wyoming – 25.68 hospitals per million people
Wyoming takes the top spot with 25.68 hospitals per million people. Despite having the smallest population, Wyoming’s total of 15 hospitals is higher than nine states, including New Hampshire, Montana, and Hawaii — all of which have at least double Wyoming’s population. This state also has 1,260 beds, an average of 84 per hospital.
2. Louisiana – 24.05 hospitals per million people
In second place is Louisiana, with 24.05 hospitals per million people. Louisiana has a total of 110 hospitals, which is the eighth-highest in the US. Louisiana also boasts a total of 14,217 hospital beds, almost 130 per hospital on average.
3. South Dakota – 23.93 hospitals per million people
South Dakota completes our top three with 23.93 hospitals per million people. South Dakota has a total of 22 hospitals, with 2,668 beds — an average of 121 per hospital. The biggest hospital in South Dakota is Sioux Falls’s Avera McKennan Hospital & University Health Center, with over 700 beds.
Hawaii has more wheelchair-accessible activities than any other state, with almost 100 per million people
We’ve revealed the US states with the most wheelchair-accessible activities per 100,000 people.
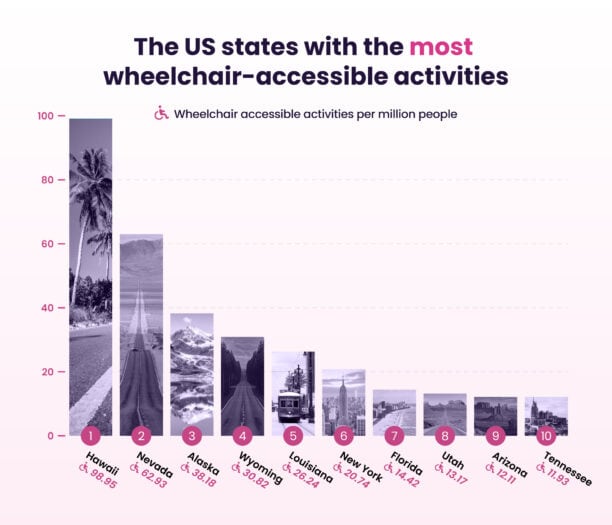
1. Hawaii – 98.95 wheelchair-accessible activities per million people
Taking the top spot is Hawaii, with 98.95 wheelchair-accessible activities per million people. Hawaii has 142 wheelchair-accessible activities in total, the fifth-highest in the US. Whale-watching cruises, guided garden tours, and cultural shows are among the activities accessible to those in wheelchairs.
2. Nevada – 62.93 wheelchair-accessible activities per million people
In second place is Nevada, with 62.93 wheelchair-accessible activities per million people. Nevada’s total of 201 wheelchair-accessible activities is also the fourth-highest in the US. Most, if not all, of Nevada’s accessible activities are in Las Vegas, including Grand Canyon tours, exciting shows, and exhibitions.
3. Alaska – 38.18 wheelchair-accessible activities per million people
Alaska completes our top three, with 38.18 wheelchair-accessible activities per million people. Alaska has 28 wheelchair-accessible activities in total, which is just in the top half of US states. The accessible activities in Alaska are mainly centered around snow and ice, including cruises, museums, and guided tours.
New Jersey has more wheelchair-accessible restaurants than any other state, with almost 900 per 100,000 people
We’ve taken the most populous city in each US state to reveal which states have the most wheelchair-accessible restaurants per 100,000 people.
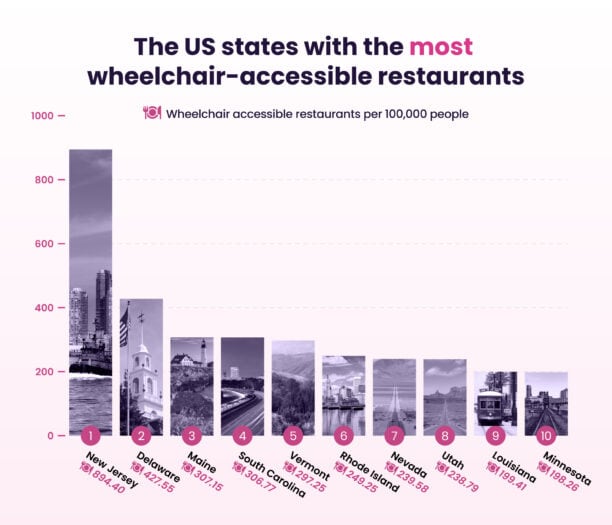
1. New Jersey – 894.40 wheelchair-accessible restaurants per 100,000 people
New Jersey takes the top spot with just under 900 wheelchair-accessible restaurants per 100,000 people. New Jersey’s most populous city, Newark, boasts 2,523 wheelchair-accessible restaurants, the most in the US. The majority of accessible restaurants are mid-range, with 200 of Newark’s total being fine dining.
2. Delaware – 427.55 wheelchair-accessible restaurants per 100,000 people
In second place is Delaware, with over 400 wheelchair-accessible restaurants per 100,000 people. Delaware’s most populous city is Wilmington, which is home to 302 accessible restaurants in total. There are 66 cheap eats and 11 fine dining options to choose from. However, the majority of accessible restaurants in Wilmington are classed as mid-range.
3. Maine – 307.15 wheelchair-accessible restaurants per 100,000 people
Maine is in third place, with 307.15 wheelchair-accessible restaurants per 100,000 people. The most populous city in Maine is Portland, where 204 out of 593 restaurants are wheelchair accessible. The quality of these restaurants is also of a high standard, with just over half of them boasting a rating of at least four out of five stars.
Methodology
For each state’s healthcare spending per capita, we used KFF.
We then used ValuePengiun for each state’s 2024 health insurance cost.
We used the American Hospital Directory for the number of hospitals in each state. We then normalized this against the population using the United States Census Bureau.
We used Get Your Guide for the number of wheelchair-accessible activities for each state. We normalized this against the population using the United States Census Bureau again.
We used Wikipedia to find the most populated city in each state. We then used Tripadvisor to find the number of wheelchair-accessible restaurants for each state’s most populated city. We then normalized this against the population using the same Wikipedia source.
Finally, we put these factors into a weighted table, giving each factor a normalized score out of 10. We then took an average of these scores to get our accessibility score.
NowPatient has taken all reasonable steps to ensure that all material is factually accurate, complete, and current. However, the knowledge and experience of a qualified healthcare professional should always be sought after instead of using the information on this page. Before taking any drug, you should always speak to your doctor or another qualified healthcare provider.
The information provided here about medications is subject to change and is not meant to include all uses, precautions, warnings, directions, drug interactions, allergic reactions, or negative effects. The absence of warnings or other information for a particular medication does not imply that the medication or medication combination is appropriate for all patients or for all possible purposes.